 Project Title
A Plug Load Monitoring and Control Technology for Office Buildings
Project Number ET15SDG7011 Organization SDG&E End-use Whole Building, Other Sector Commercial, Public, Other Project Year(s) 2015 - 2016Project Summary
In support of California’s strategic plan to accelerate the penetration of energy efficiency technologies, this report presents the findings of a field evaluation of a plug load monitoring and control technology in an office building. The work was executed by Alternative Energy Systems Consulting Inc. for the San Diego Gas and Electric Emerging Technology program.
The primary goal for this project was to determine the energy savings of the plug load control technology in a typical office building setting. The technology consists of networked power strips which communicate with an external vendor cloud server. The cloud server hosts data collection, trending, and controls through the use of scheduling and logical rules. Each power strip receptacle switches on and off according to user-defined schedules or master/control rules. The estimated cost for 104 four-receptacle power strips, 3 cloud communication bridges, and annual data service fees is about $11,933 for the first year and $1,040 each subsequent year.
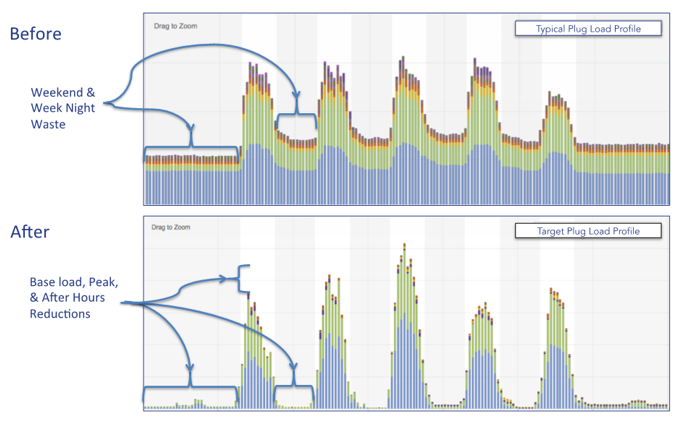
A field trial was conducted with 104 power strips on a single floor of a large commercial office building located in San Diego. The hourly analysis used validated data from the vendor’s cloud servers to calculate savings by comparing 13 days of baseline and 29 days of post-controls energy usage. All relevant plug loads on the floor were included: printers, coffee makers, computers, monitors, speakers, as well as other typical office equipment. These savings were largely attributable to a small subset of the total plug load types: desktop computers, monitors, refrigerators, copy printers, and water dispensers. Figure 1 in the report shows the baseline and post hourly load profile for an average 4-outlet power strip. Load profiles for various equipment types are also included in the report.
For the single office building floor, this amounted to annual energy savings of 11,419 kWh/year or 19.9% of the baseline consumption. Assuming that each 4-outlet power strip is roughly associated with one desk, the technology saves about 114 kWh per office employee or workstation. The energy savings and demand reduction were higher during off-peak hours when equipment was in less use. This distribution of savings is typical of plug load controls whose schedules follow typical office business hours. The technology implementation reduced plug load demand and energy consumption for each time-of-use (TOU) period as listed in Table 1.
Table 1 - TOU Savings Summary and Distribution
Time-of-Use Period Baseline Energy [kWh] Energy Savings [kWh] Baseline Demand [kW][1] Demand Reduction [kW]
Summer on-peak 7,765 448 (5.8%) 22.34 1.69 (7.6%)
Summer semi-peak 7,401 792 (10.7%) 17.80 2.89 (16.3%)
Summer off-peak 13,578 4,469 (32.9%) 15.71 8.74 (55.7%)
Winter-on-peak 2,500 204 (8.2%) 17.91 2.57 (14.4%)
Winter semi-peak 12,667 1,037 (8.2%) 20.22 2.32 (11.5%)
Winter off-peak 13,578 4,469 (32.9%) 15.71 8.74 (55.7%)
Total Annual 57,489 11,419 n/a n/a
[1] Baseline demand and demand reduction refer to hourly maximum demand (billing demand) rather than average load.
Based on the technology costs and savings estimates using a TOU rate structure, the payback was shown to be about 11.7 years without any utility program incentive. This payback was calculated using the technology cost and inflation-adjusted TOU energy cost savings which amounted to about $1,783 starting on the first year.
The technology was effective at achieving energy savings through a combination of automated controls and behavioral changes. It is likely that the effectiveness of the technology could be further improved through various efforts that encourage more end-user participation and continued optimization of the control strategies. Furthermore, ROI could possibly be improved by focusing only on the plug load types which yield the greatest savings rather than performing a blanket installation across all plug loads in the building. There were many instances of receptacles having zero or near zero loads. Focusing on the plug load devices that provide the best return and including power strips with fewer receptacles may result in improved payback.
One of the risks related to this system is that energy savings could be eliminated if customers move their devices to different outlets without updating the system settings. This could result in unwanted shutdowns, ineffective shutdowns, or confusion in the energy monitoring user interface. However, this potential risk could likely be mitigated through proper workforce training and diligence by the facility or energy management staff. As a result, close collaboration and agreement between employees, facility managers, vendors, and IT staff is critical to the success of this technology. If this type of cooperation is possible, the technology has promise for behavioral and automated energy savings within a particularly unaddressed electrical end-use.